Chapter 1: Introduction to Data-Driven Creativity
Objective: Understand the intersection of art, design, and data science and how they influence each other.
🔹 The Historical Connection Between Art & Science
How Renaissance artists like Da Vinci used mathematics in their works
The rise of digital art and computational creativity
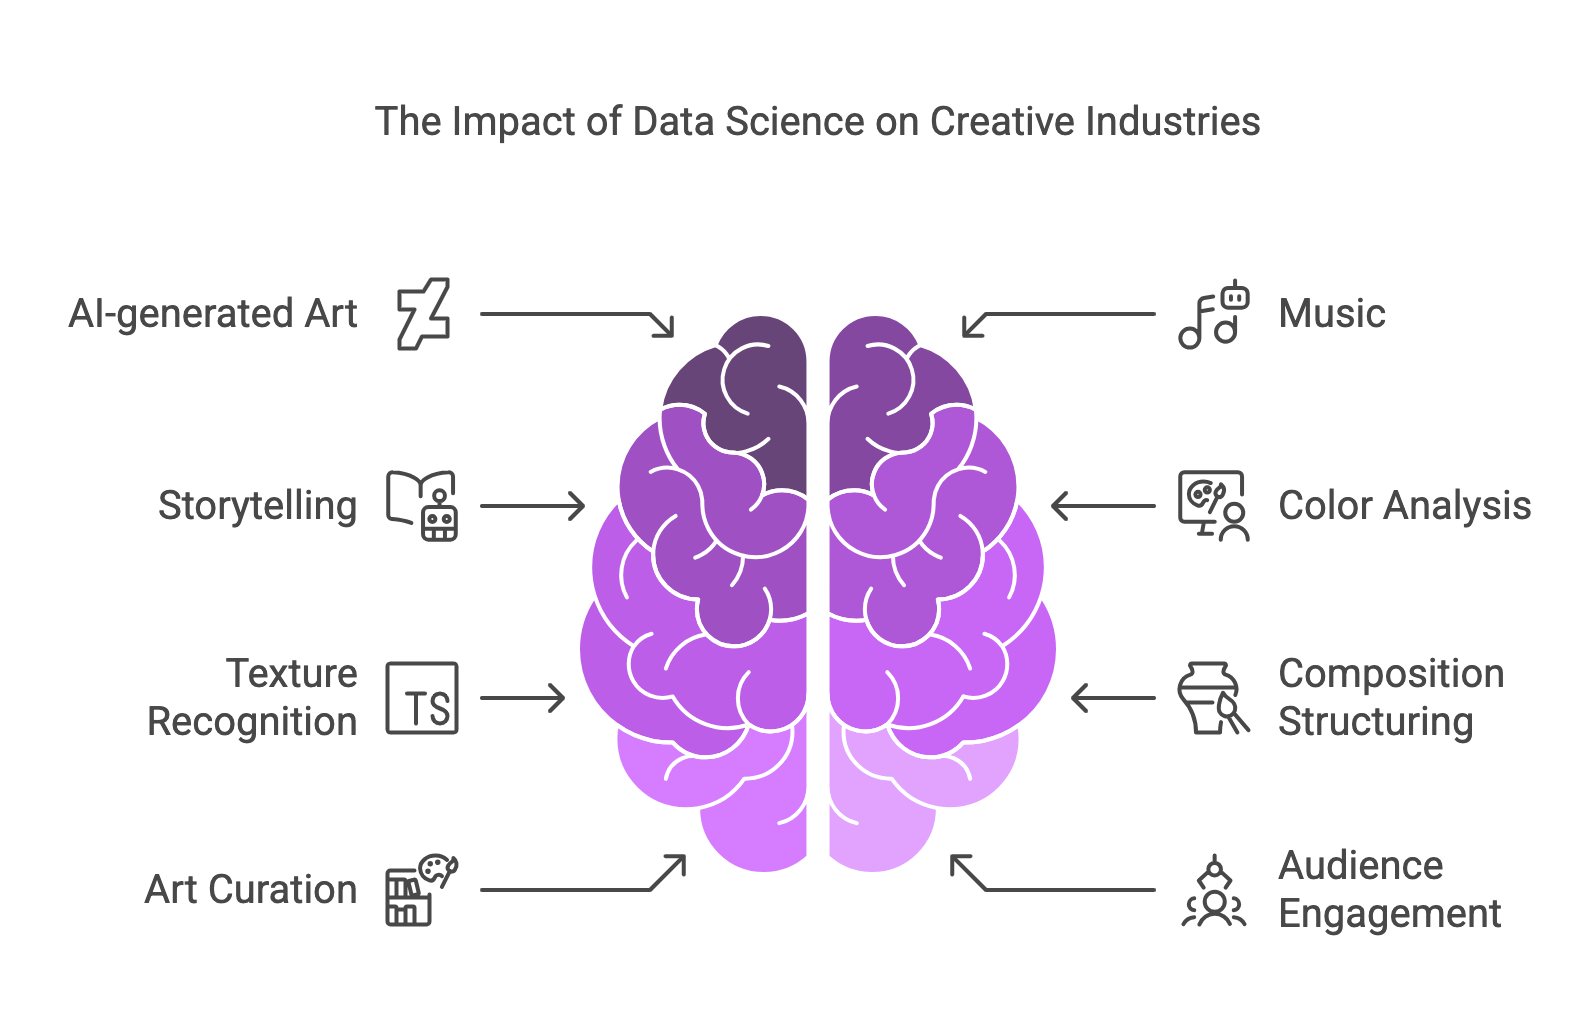
🔹 How Data Science is Transforming Creative Industries
Role of data in modern graphic design, animation, and music
Real-world applications: Museums using AI for curation, fashion brands using data-driven design
🔹 Case Studies: Artists & Designers Using Data-Driven Techniques
Refik Anadol’s AI-generated immersive art
Anna Ridler’s GAN-generated artwork
Data-driven music composition (e.g., OpenAI’s MuseNet)
🔹 Computational Thinking in Artistic Processes
Introduction to algorithmic design & generative art
Breaking down creative processes into data-driven frameworks
🔹 Tools & Software for Data-Driven Creativity
Python Libraries: Matplotlib, Seaborn, TensorFlow for art
AI Art Tools: RunwayML, DeepDream, DALL·E
Data Visualization Tools: Tableau, Flourish, Processing